
Quick answer: Amazon reported $716.9 billion in net sales for 2025, and independent (third-party) sellers account for more than 60% of sales in the Amazon store. Marketplace Pulse estimates about 1.65 million active sellers on Amazon.com at the end of 2025, while only around 165,000 new sellers launched their first listing that year, the lowest number in a decade. Below are the Amazon seller statistics and marketplace facts that matter most if you sell on Amazon, with the source behind each figure.
Key Amazon Seller Statistics for 2026
- Total net sales: $716.9 billion in 2025, up 12% from $638.0 billion in 2024. Q4 2025 alone brought in $213.4 billion (Amazon Q4 2025 results, February 2026).
- Share of sales from independent sellers: more than 60% of sales in the Amazon store come from independent sellers (Amazon).
- Third-party share of units: third-party sellers accounted for about 60% of paid units in Q1 2026, down from 61% in Q4 2025 and 62% in Q3 2025, as Amazon’s own retail business regained some share (Marketplace Pulse).
- How many sellers are on Amazon: about 1.65 million active sellers on Amazon.com at the end of 2025, down from 2.4 million in 2021 (Marketplace Pulse estimate).
- New sellers: roughly 165,000 new sellers launched their first product listing on Amazon.com in 2025, down 44% from 2024. That is about 450 a day, far below the “3,700 new sellers a day” figure still quoted from older reports.
- Where sellers are based: Chinese sellers now make up more than 50% of Amazon’s global active seller base and about 60% of new sellers who launched in 2025; US-based sellers were about 16% of new launches (Marketplace Pulse).
- Average US seller sales: independent sellers in the US averaged more than $375,000 in annual sales in Amazon’s store in 2025 (Amazon).
- Million-dollar sellers: more than 75,000 independent sellers surpassed $1 million in sales in 2025, according to Amazon. Marketplace Pulse estimates that over 100,000 sellers now generate $1 million or more a year, and 235 sellers generate $100 million or more.
- Fast growers: over 11,000 US-based independent sellers grew their sales by more than 10x in 2025 (Amazon).
- Third-party GMV: an estimated $305 billion in the US and $575 billion globally (Marketplace Pulse).
- Prime Day: Prime Day 2026 was a four-day event held in June. Adobe measured $26.4 billion in US online spending across all retailers during the event, up 9.3% from the July 2025 Prime Day. Amazon does not publish its own Prime Day sales totals.
How to read these numbers: Amazon’s figures come from its earnings releases and seller pages, Marketplace Pulse figures are independent estimates, and the survey percentages further down (from Jungle Scout’s State of the Amazon Seller surveys) describe the sellers who answered those surveys, not every seller. Check the source and year before you quote a statistic. For the biggest names on the marketplace, see our list of the biggest Amazon sellers in the world.
Multichannel Selling
Many Amazon sellers also sell on other channels, such as Walmart Marketplace, eBay, their own Shopify store, TikTok Shop or Etsy. Selling on more than one channel spreads risk if a listing or account runs into trouble on Amazon, but it also adds inventory and customer-service work, so most sellers keep Amazon as their main channel and add one or two others.
Amazon Product & Categories Statistics
Knowing which categories sellers compete in helps you decide where to source. The table below comes from an earlier edition of Jungle Scout’s State of the Amazon Seller survey and shows categories that relatively few surveyed sellers reported selling in, which can mean less competition. For current demand, check Best Sellers Rank data and our guide to the top Amazon product categories.
|
Category |
Share of Surveyed Sellers |
|
Appliances |
12% |
|
Garden & Outdoor |
11% |
|
Cell Phone & Accessories |
10% |
|
Apps & Games |
8% |
|
Automotive |
8% |
|
Handmade |
6% |
|
Computers |
5% |
|
Industrial & Scientific |
5% |
|
Collectibles & Fine Art |
5% |
|
CDs & Vinyl |
4% |
Sellers who manufacture or import products have historically sourced mostly from China, but that is shifting. Jungle Scout’s 2025 State of the Amazon Seller report found that fewer businesses are sourcing from China, while sourcing from the US has nearly doubled. Rising costs are the main driver:
- Tariffs and the end of de minimis: the US ended duty-free de minimis treatment for low-value imports from China and Hong Kong in May 2025 and for all countries on August 29, 2025, so small shipments now pay duties.
- Higher costs across the board: in Jungle Scout’s 2025 survey, 38% of enterprise brands named higher shipping costs as a top challenge, 34% the rising cost of goods and 32% growing advertising expenses.
- More resilient supply chains: many sellers now spread sourcing across several countries, or buy domestically through wholesale and retail or online arbitrage, to reduce their exposure to tariff changes.

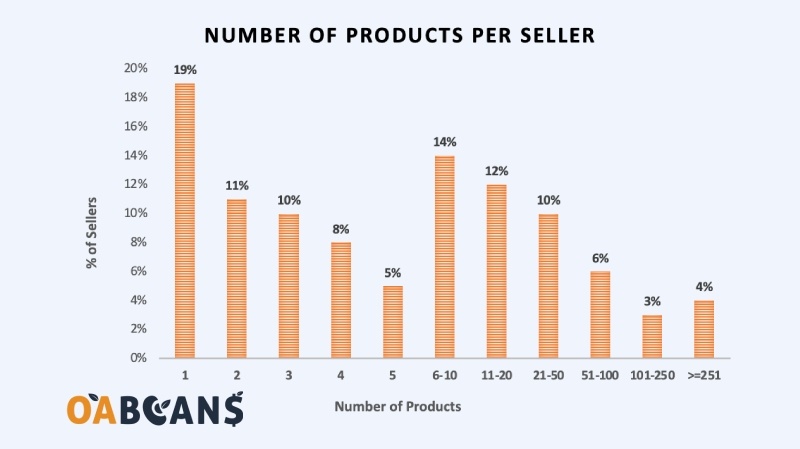
In earlier Jungle Scout seller surveys, sellers often reported sourcing from several countries at once, so the percentages add up to more than 100%. In addition to major suppliers like China, sellers identify other sourcing countries, including Taiwan and Hong Kong. Other notable sourcing countries include Vietnam, Belgium, Bangladesh, Pakistan, and Turkey. The same surveys found that 88% of sellers offered 50 or fewer products and about 19% listed only a single product.
Who Sells on Amazon: Seller Demographics and Fulfillment
Jungle Scout’s seller surveys give a useful picture of who sells on Amazon. Keep in mind that these percentages describe survey respondents:
Seller Demographics:
-
Location: About 47% of surveyed sellers were based in the United States, 9% in Canada, 6% in the United Kingdom and 4% in India. Across the whole marketplace, however, Chinese sellers now make up more than half of active sellers (Marketplace Pulse).
-
Gender: Consistently over the years, about two-thirds of Amazon sellers identify as male.
Education: A significant majority, 85%, of sellers possess some level of post-secondary education, ranging from associate degrees to doctoral studies.
Fulfillment Methods:
-
FBA (Fulfillment by Amazon): Roughly 82% of surveyed sellers use FBA, benefiting from Amazon’s extensive fulfillment network and Prime customer base.
-
FBM (Fulfillment by Merchant): Around 34% of sellers opt for FBM, either exclusively or alongside FBA, handling storage and shipping themselves. See our Amazon FBA vs FBM comparison for the trade-offs.
The chart below, from an earlier Jungle Scout survey, shows which business models sellers use. Private label remains the most common, while wholesale, retail arbitrage and online arbitrage stay popular with resellers who would rather not manufacture their own products. If reselling interests you, start with our guide to what online arbitrage is and how it works.
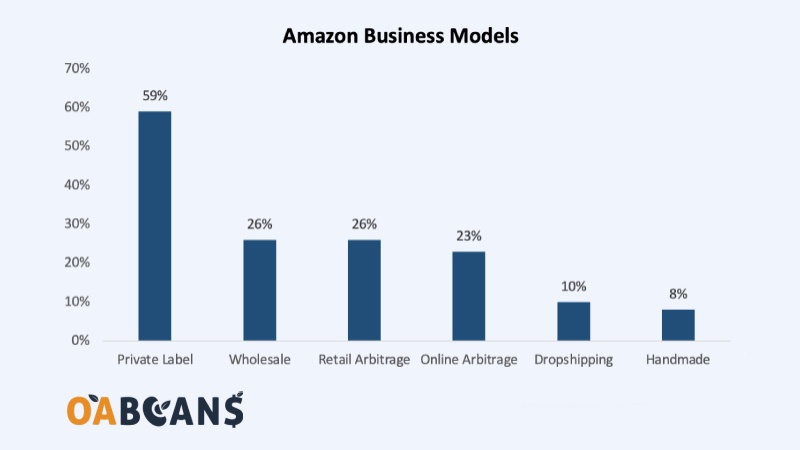
It’s important to note that many sellers employ both FBA and FBM methods, leading to overlapping percentages.
Recent developments for sellers:
- 2026 fee update: Amazon published updated U.S. referral and FBA fees for 2026, and fee schedules now change at least once a year. Check the current rates in Seller Central and in our Amazon FBA fees guide before you price a product.
- Fewer new sellers, bigger established sellers: new seller launches hit a decade low in 2025 while the number of million-dollar sellers kept growing, so you increasingly compete with experienced, well-funded sellers.
- New marketplaces: Amazon keeps adding stores, including South Africa (2024) and Ireland (2025), which gives sellers more options to sell internationally.
Together, these trends describe a maturing marketplace: fewer newcomers, more professional sellers, and margins that depend on watching fees and sourcing costs closely.
Know More About Amazon Top Sellers in the World
Sales and Profitability of Amazon Sellers

Building a lucrative business is a common aspiration among Amazon sellers. Sales and profitability vary widely, influenced by factors such as business model, experience, and company size.
Sales Performance:
-
Monthly Sales: In Jungle Scout’s surveys, sellers’ monthly sales range from under $500 to more than $250,000, and about 45% of sellers generate between $1,000 and $25,000 monthly, equating to annual sales between $12,000 and $300,000.
-
Annual Sales: Independent sellers in the US averaged more than $375,000 in annual sales in Amazon’s store in 2025, up from more than $290,000 in 2024 (Amazon).
Profitability:
-
New Sellers: First-year results vary widely; many new sellers earn modest profits while they learn sourcing, pricing and fees.
-
Established Sellers: In earlier surveys, about 30% of small and mid-sized sellers had earned over $50,000 in lifetime profits, with 10% making between $100,000 and $500,000.
-
Profit Margins: Over half of surveyed sellers (55%) report profit margins higher than 15%, with 38% achieving margins above 20%. Conversely, 13% of sellers indicate their businesses are not yet profitable.
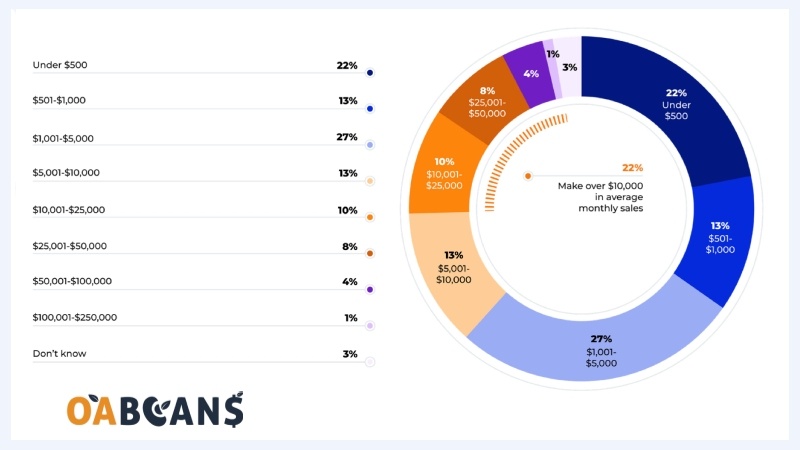
With increasing years of experience on Amazon, sales volumes tend to rise. Approximately 22% of small and medium-sized businesses (SMBs) achieve average monthly sales exceeding $10,000. In Jungle Scout’s surveys, a majority of sellers report becoming profitable within their first year.
On margins, surveyed sellers consistently report solid results: more than half report margins above 15%, and 38% report margins above 20%. Before you buy inventory, use a calculator that includes every fee; see how to calculate Amazon profit accurately.

Do You Know How Much Money Do Amazon FBA Sellers Make?
Top Challenges for Amazon Sellers in 2026
The biggest obstacles sellers face today come down to cost and competition:
- Rising costs: shipping, cost of goods and advertising were the top three challenges cited by enterprise brands in Jungle Scout’s 2025 survey.
- Tariffs and import costs: new tariffs and the end of duty-free de minimis shipments have raised landed costs for imported products.
- Fees: referral, FBA, storage and inbound placement fees need to be modeled for every product, because small fee changes can wipe out thin margins.
- Experienced competition: with new seller launches at a decade low and more sellers above $1 million in sales, the typical competitor is larger and more professional than a few years ago.
- Account health and compliance: Amazon enforces policies, documentation and category restrictions strictly, so keep your Amazon account health in good standing.
- Cash flow: balancing inventory, ad spend and payout timing takes careful planning, especially before Q4.
- Channel diversification: many sellers are adding Walmart Marketplace, TikTok Shop or their own store to reduce dependence on a single platform.
Final Thought
Amazon remains the largest ecommerce marketplace in the US, and independent sellers still drive more than 60% of its sales. The latest numbers also show a more competitive, more professional marketplace: fewer new sellers, more seven-figure sellers and higher costs. Following these statistics helps you set realistic expectations and pick a business model that fits your capital and time. If you resell, a curated online arbitrage leads list can save hours of product research, but always check each deal’s fees, restrictions and sales rank before you buy.
FAQs About Amazon Seller Statistics
Sources:
[1] Jungle Scout, State of the Amazon Seller 2025
[2] https://www.statista.com/statistics/788109/amazon-retail-market-share-usa/
[3] https://www.bigcommerce.com/blog/amazon-statistics/
[4] Amazon, Fourth Quarter 2025 Results (February 2026)
[5] Amazon, Amazon stats for sellers
[6] Marketplace Pulse, Amazon seller registrations hit decade low in 2025