Introduction to Keepa for Analyzing OA Leads
To online arbitrage sellers on Amazon, Keepa is like a pair of x-ray goggles that lets them see through the noise and confusion of the Amazon marketplace and make sense of the data surrounding a product. It’s a strategic advisor that helps sellers make intelligent, data-driven decisions. Now, let’s get to know this tool a little better:
What is Keepa?
Keepa is a comprehensive price-tracking tool that monitors and analyzes vast data from the Amazon marketplace. Using Keepa, you can get valuable insights about a product’s price history, sales rank, review trends, and competition.
Keepa works by constantly scanning and tracking the price of millions of products on Amazon. It collects historical product data and presents them to sellers in an easy-to-understand format. But Keepa has another important feature – it allows sellers to conduct a reverse search for products using customizable filters such as specific brands, number of offers, Buy Box eligibility, etc.
The Importance of Keepa for Analyzing OA Leads
As mentioned, Keepa is an invaluable and must-have tool for every online arbitrage seller. Here’s why Keepa is essential for analyzing Amazon FBA leads:
- Understanding price history: Keepa’s comprehensive graphs and charts show how a product’s price has fluctuated over time. This helps you determine whether a lead is risky or has a stable price history.
- Evaluating product sales: Keepa also tracks the sales rank history of products, directly indicating the consistency of their demand and popularity among customers.
- Identifying seasonal trends: Keepa’s long-term sales rank and price history charts can reveal seasonal trends for specific products. For example, holiday decorations sell well during Christmas.
- Making informed buying decisions: Keepa’s deal alert feature allows you to set specific criteria (price, sales rank and rating, reviews, etc.) for a product, and you’ll be notified when, for example, the price of that product drops to your desired level.
- Minimizing risk: the comprehensive data provided by Keepa helps reduce the risks associated with online arbitrage. With Keepa, you will be less likely to invest in a product with too much competition or unstable prices.
Setting Up Your Keepa Account
Setting up your Keepa account is a straightforward process. Here are the steps to do this:
- Go to the Keepa website (https://keepa.com/)
- On the top-right corner of the homepage, clock on “Register.”
- Fill in your username, email address, and password in the registration form.
- Agree to the terms of service and privacy policy by checking the respective boxes.
- Click on “Create Account.”
- Check your email for a confirmation message, and click the provided link.
- Your account is set up and good to go!
Choosing the Right Subscription Plan
Keepa offers both free and paid subscription plans. The paid subscription costs only 19 € per month and has many more valuable features.
The free plan gives you access to price history charts, but you can’t use other features like review graphs. This is a good starting point for beginners, but if you are serious about online arbitrage, you will eventually have to pay the subscription to access all the features. The premium features include sales rank history graphs, Buy Box statistics, offer count and review/rating history, access to 5 API tokens, etc.
Installing the Keepa Browser Extension
To install the Keepa browser extension, go to the “Apps” tab on the website. You can install the extension here by clicking on your browser’s icon (Firefox, Chrome, Opera, Microsoft Edge, or Safari). Alternatively, you can search Google to find and download the Keepa extension for your browser.
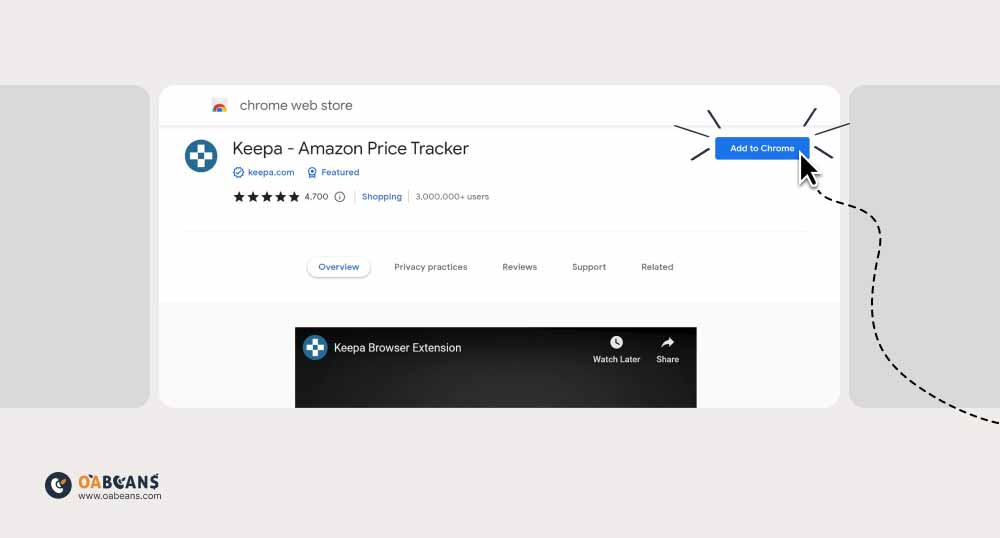
To download the Keepa Chrome extension, click here.
Keepa Graph Elements
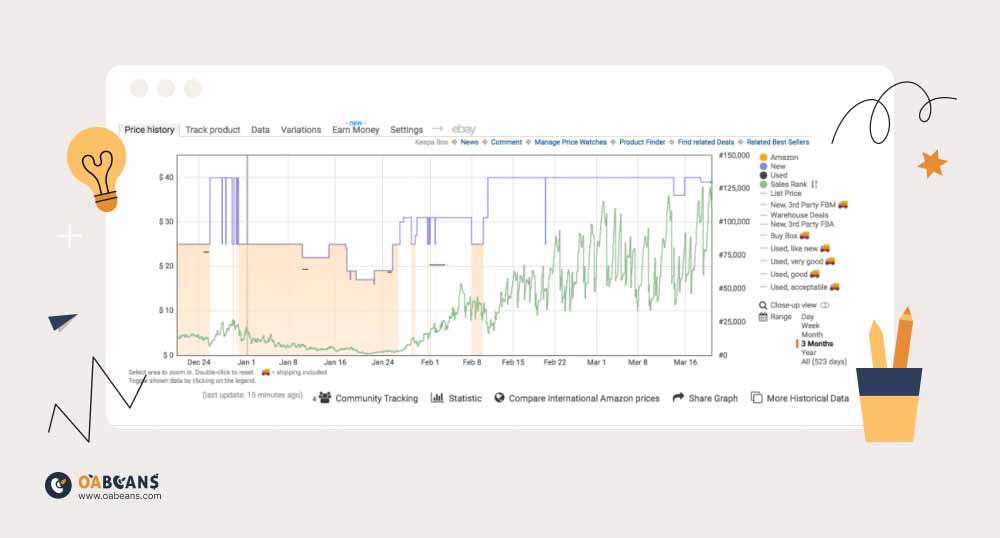
This is an example of a Keepa graph, which may look confusing at first. However, once you know what the colours and numbers mean, it’s easy to interpret the graph.
The Keepa graph shows product price history. You can see the price levels on the left-hand side of the graph and the sales rank figures to the right. The bottom of the graph displays the dates, and you can see the menu that lets you customize your view and the data points on the right. You can turn any of the items in the menu on or off – for example, you can view only the Amazon graph, new/used products, sales rank, or buy box. You can also set a period (day, week, month, 3 months, year, or all) to view the data.
Keepa Graph Color Key
Knowing what all the colours mean can be very helpful in interpreting a graph. Here is the Keepa graph colour key:
Top Graph
- Orange = Amazon
- If Amazon is listed as a seller, you should consider it a red flag because it’s very difficult to compete with Amazon, especially as an inexperienced seller.
- Blue = Marketplace New (the lowest product offer in the New condition from a 3rd party seller)
- Black = Marketplace Used (the lowest product offer in the Used condition from a 3rd party seller)
- You can use the lowest product offer to get a picture of the minimum current price level, set a price, and estimate potential profit. However, remember that the lowest price doesn’t mean the optimal one. If you are a FBA seller, you must consider other FBA sellers’ pricing, and if you use FBM, you should look at FBM offers.
If you want to consider the lowest-priced offer as an FBA seller, remember that it may come from an FBM merchant and not include shipping fees. So, shipping costs must be added to the price.
- Green = Sales Rank
- Since sales rank changes, you must analyze the average figure and the trend – upwards or downwards – to see if product sales increase or decrease. Also, suppose the sales rank goes down to zero during specific periods. In that case, the product is seasonal, so it only sells within a particular season (e.g., summer sandals or Halloween decorations).
- Magenta diamond = Buy Box
- The Buy Box price shouldn’t drop or fluctuate too much. If it does, you can’t sell the product at a stable price, and you must consider the average Buy Box price. When the number of sellers grows, the Buy Box price drops because sellers engage in a price war. If it goes up, that means sellers are leaving the listing.
- Orange triangle = New 3rd party FBA (the lowest FBA seller product offer in the New condition)
- Blue square = New 3rd party FBM (the lowest FBM seller product offer in the New condition).
Bottom Graph
- Blue = Rating
- Green = Review Count
- A product with no or bad reviews and ratings will likely not sell or generate enough ROI. Therefore, it’s best to focus on products with more than 10 reviews (and an upward-moving trend instead of a flat one) and a rating of 4 stars and up.
- Indigo = New Offer Count
- New Offer Count, Review Count, and Ranking are shown in a separate graph at the bottom. New Offer Count means other sellers are offering the same item, and increased competition – not too much – usually means that a product is popular and worth selling.
Understanding keepa’s Key Data Points
The critical data points Keepa offers include price tracking, sales rank, review and rating history, new offer count, price history, and Buy Box ownership. Now, let’s break down each of these data points:
Product Price History and Comparison
Keepa’s graphs and charts are the primary data points this tool offers. Keepa allows you to monitor the prices of products over time, helping you understand pricing trends and identify the best times to buy or sell. The price history charts have many filters, such as Amazon price, 3rd party FBA/FBM price, etc. Most sellers use the Buy Box filter to determine which price has the best chance to win the Buy Box.
Sales Rank Tracking
Sales rank or BSR (Best Sellers Rank) measures how well a product sells compared to other products in the same category. The sales rank graph on Keepa shows you the product’s BSR over time. You can also customize this graph using category and sub-category filters. Analyzing the sales rank history allows you to evaluate the product’s popularity over time and identify high-demand products.
Review & Rating History Chart
The review/rating chart shows the product’s review and rating history, providing insights into its quality and customer satisfaction. A low number of reviews and a low rating are bad indicators, but a high, ascending review graph indicates that the product has performed well in customer satisfaction and quality.
New Offer Count
The new offer count feature shows how many sellers have offered the product (in a new condition) over a specific period. It’s a good indicator of the product’s competition. The new offer count shouldn’t be too high, but it shouldn’t be too low or non-existent. The reasonable new offer count depends on your business strategy, but <10 is an excellent place to start.
Price Tracking and Alerts
The “Track Product” section allows you to set specific filters for a product so that Keepa notifies you when the product’s price drops to your desired level. Keepa can inform you via various mediums like email, Telegram, mobile apps, etc. There are three tracking modes: Basic, Advanced, and Pro.
The Basic mode allows you to track products based on Buy Box price, Amazon Price, new/used price, timeline, and country. With the Advanced mode, you can include shipping costs, Prime/Warehouse only, and lightning deals. The Pro mode offers more filters based on sales rank, rating, review, and collectible/used/refurbished.
Click here to learn more about how to check Amazon products’ price history.
Buy Box Ownership
The Buy Box is a box on the product detail page where customers can add items to their carts. Winning the Buy Box is an excellent opportunity for sellers to increase sales. By looking at the Buy Box statistics on Keepa, you can get invaluable insights about the competition and how you can win the Buy Box yourself. Buy Box statistics show which sellers have won the Amazon Buy Box with what prices and how many reviews.
The Buy Box statistics also allow you to determine a product’s risk. Amazon rotates the Buy Box among eligible sellers, so if a specific seller has repetitively won it, it’s a risky product, and it is challenging to compete with them.
Analyzing Online Arbitrage Leads with Keepa
Analyzing OA leads with Keepa has a few strategic steps. You’ll primarily use Keepa’s price, sales rank, and review/rating history charts, but other data points like competitors’ in-stock level and seasonal trends can also be helpful. Here’s how you can use Keepa to analyze OA leads:
Evaluating Price History for Profitability
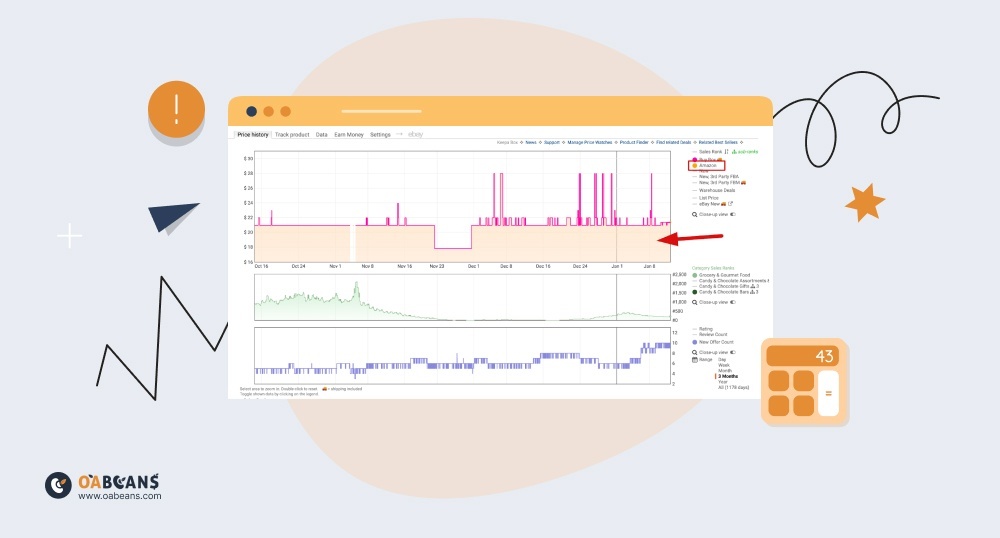
The price history chart on Keepa shows a product’s price has fluctuated over time. If the product experiences regular dips and spikes, it’s best to avoid it because it’s a risky lead. Going for products with a consistently stable price is recommended, but this depends on your business strategy and how much risk you’re willing to take.
Assessing Sales Rank and Its Impact on Demand
The sales rank, or BSR, is a good indicator of the demand and popularity of a product over time. However, it’s a tricky metric to work with because online arbitrage sellers deal with various categories, and a good BSR can mean different things from one category to another. Avoiding products not ranked in the 1% best-sellers in the main categories is recommended, but this depends on your business strategy.
Considering Product Stock and Availability
As mentioned, you can find out how many sellers offer a product on Amazon and how much they have in stock using Keepa. If the number of sellers offering a product is low but has a high in-stock level combined (for example, 1000) while its monthly sale is 100, the competition is too high, and it’s best to avoid that product. You can look at “Offers” under the Data tab to determine the number of sellers, prices, in-stock levels, reviews, etc.
Identifying Seasonal Trends and Fluctuations
Some items only sell during specific times of the year, such as Halloween, Christmas, etc. These products are great buys, but their prices are constantly fluctuating. You can use Keepa to determine the product’s price during the last season and when it is most profitable.
Making Informed Buying Decisions with Keepa
As mentioned, one of the primary benefits of using Keepa is making informed and data-driven buying decisions. Here are some of the ways Keepa can help you with this:
Calculating Estimated Profit and ROI
Keepa doesn’t directly provide a way to calculate estimated profit and ROI, but you can use its data and other information to make these calculations.
First, you must look at the price history on Keepa to determine a potential selling price based on the patterns or fluctuations. Then, you must calculate all costs, including shipping fees, Amazon fees, storage or prep services, etc. After that, you can estimate the profit by subtracting your total expenses from the selling price. To calculate ROI, divide your estimated profit by the product cost and multiply by 100 to get a percentage.
Determining the Ideal Purchase Quantity
The ideal purchase quantity means balancing buying enough to make a profit and not buying so much that you’re left with unsold inventory. To determine the perfect purchase quantity, analyze the lead’s sales rank history, price history, stock levels, and seasonal trends on Keepa while keeping your business strategy and risk-taking ability in mind.
Weighing the Risks and Rewards of a Lead
You need to find the balance between the risks and rewards of a lead. To do this, calculate the estimated profit and ROI for the product, analyze its price and sales rank history to assess its demand, and consider other attributes such as competition level, seasonal trends, reviews, etc. Then, weigh the potential challenges and downsides such as brand/category restrictions, available capital and storage, and whether Amazon is selling the product. Consider your risk-taking ability and the state of your business, and set a threshold for each criterion.
Keepa Data: Maximizing keepa’s Potential
The Data tab in Keepa is where you’ll find a wealth of product information and can conduct a reverse search for sourcing products. Let’s break down the most important sections of this tab:
Product Finder
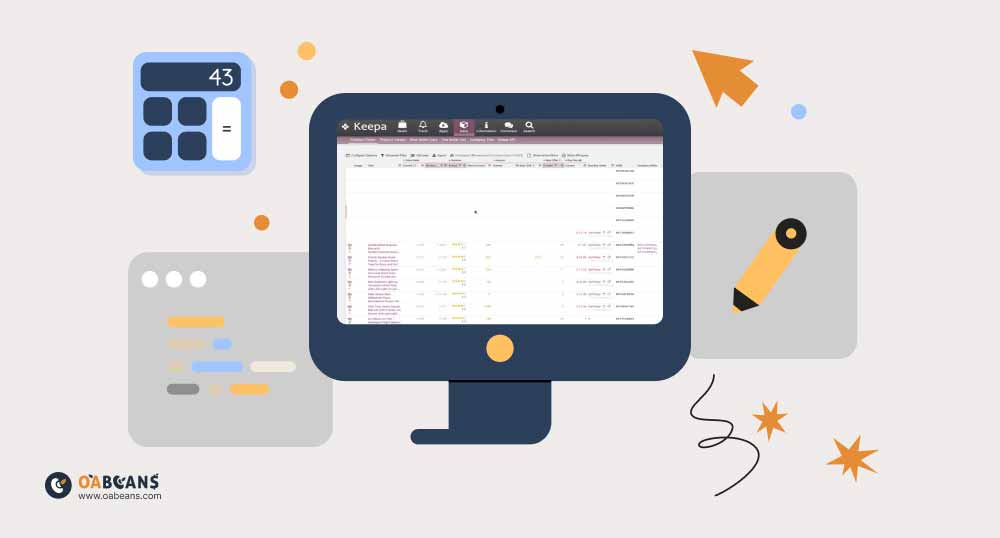
This is where you can search for products directly within Keepa’s database based on various criteria. You can filter results by category, sales rank, price ranges, and more. You can set some filters; most sellers use sales rank, Buy Box, and other filters based on their unique sourcing strategy.
After getting your search results, you can find a seller offering the product you want to sell and enter their seller ID in Product Finder or Seller Lookup. This way, you can see all the products sold by that specific seller and piggyback off their experience by offering their most successful products.
Product Viewer
In this section, you can upload a text file containing a list of ASINs and get Keepa data for these products. Using the premium plan on Keepa, you can upload up to 10.000 ASINs (5 for free users). This is very useful when you have a list of leads from another source and want to analyze them quickly using Keepa. Once the data is loaded, you can sort and filter the results based on your criteria.
Product Best Seller
This section gives you a look at the top-selling products in each Amazon category. You can use this to find potential product ideas and see what’s currently popular. The products are sorted based on their sales rank, and you can access Keepa’s data for each product directly from the list. You can also export the list for further analysis.
Advanced Tips for Using Keepa
Final Thoughts: Mastering Keepa for Better Online Arbitrage Decisions
Ask any online arbitrage seller, and they will tell you that Keepa is any OA seller’s primary tool for sourcing and making smart buying decisions. It’s a comprehensive suite of features that provide insight into different aspects of a lead, including sales rank and price history, Buy Box ownership, review/rating history, etc. You can use this invaluable tool to track your favorite products, conduct a reverse product search by setting customizable filters, and more. The more informed your decisions, the more likely you are to succeed in the dynamic world of online arbitrage.








16 responses to “How to Use Keepa for Smart Online Arbitrage Purchases?”
With Amazon FBA, you can outsource the time-consuming tasks of inventory storage, packaging, and shipping, allowing you to focus on growing your business.
With Amazon’s fulfillment services, resellers can offer fast and efficient shipping options, enhancing customer satisfaction.
The Amazon marketplace offers a seamless shopping experience for buyers, increasing the likelihood of repeat purchases from resellers.
By staying updated on market trends and leveraging Amazon’s data insights, retail arbitrage sellers can make informed sourcing decisions and stay ahead of the competition.
Reselling on Amazon encourages creativity and entrepreneurship, as sellers can source unique and niche products.
Online arbitrage on Amazon allows you to source products with high demand and low competition, giving you an edge in the marketplace.
Amazon’s advertising tools, such as Sponsored Products and Amazon PPC, help resellers boost product visibility and reach a wider audience.
The FBA program offers fast and reliable shipping, which is essential in today’s competitive e-commerce landscape.
The Amazon platform offers advanced search and recommendation algorithms, increasing the discoverability of your reselling products.
I love the convenience of Amazon FBA. With the fulfillment services, I can focus on growing my business while Amazon takes care of the logistics.
The advanced tools and resources provided by Amazon make it easier to track sales performance, monitor market trends, and optimize your reselling strategy.
Keepa’s support is incredibly quick and knowledgeable. Even without a chat function, I received a helpful response within minutes, including on weekends.
the fact that i can get data on as many ASINs as I want is incredible!
its a very useful extension, specially if you’re short of time
Impossible to buy something on Amazon or anywhere without checking first price history thanks to this addons on Amazon, Big thanks to Keepa!
It would be great if it worked for Amazon Australia