
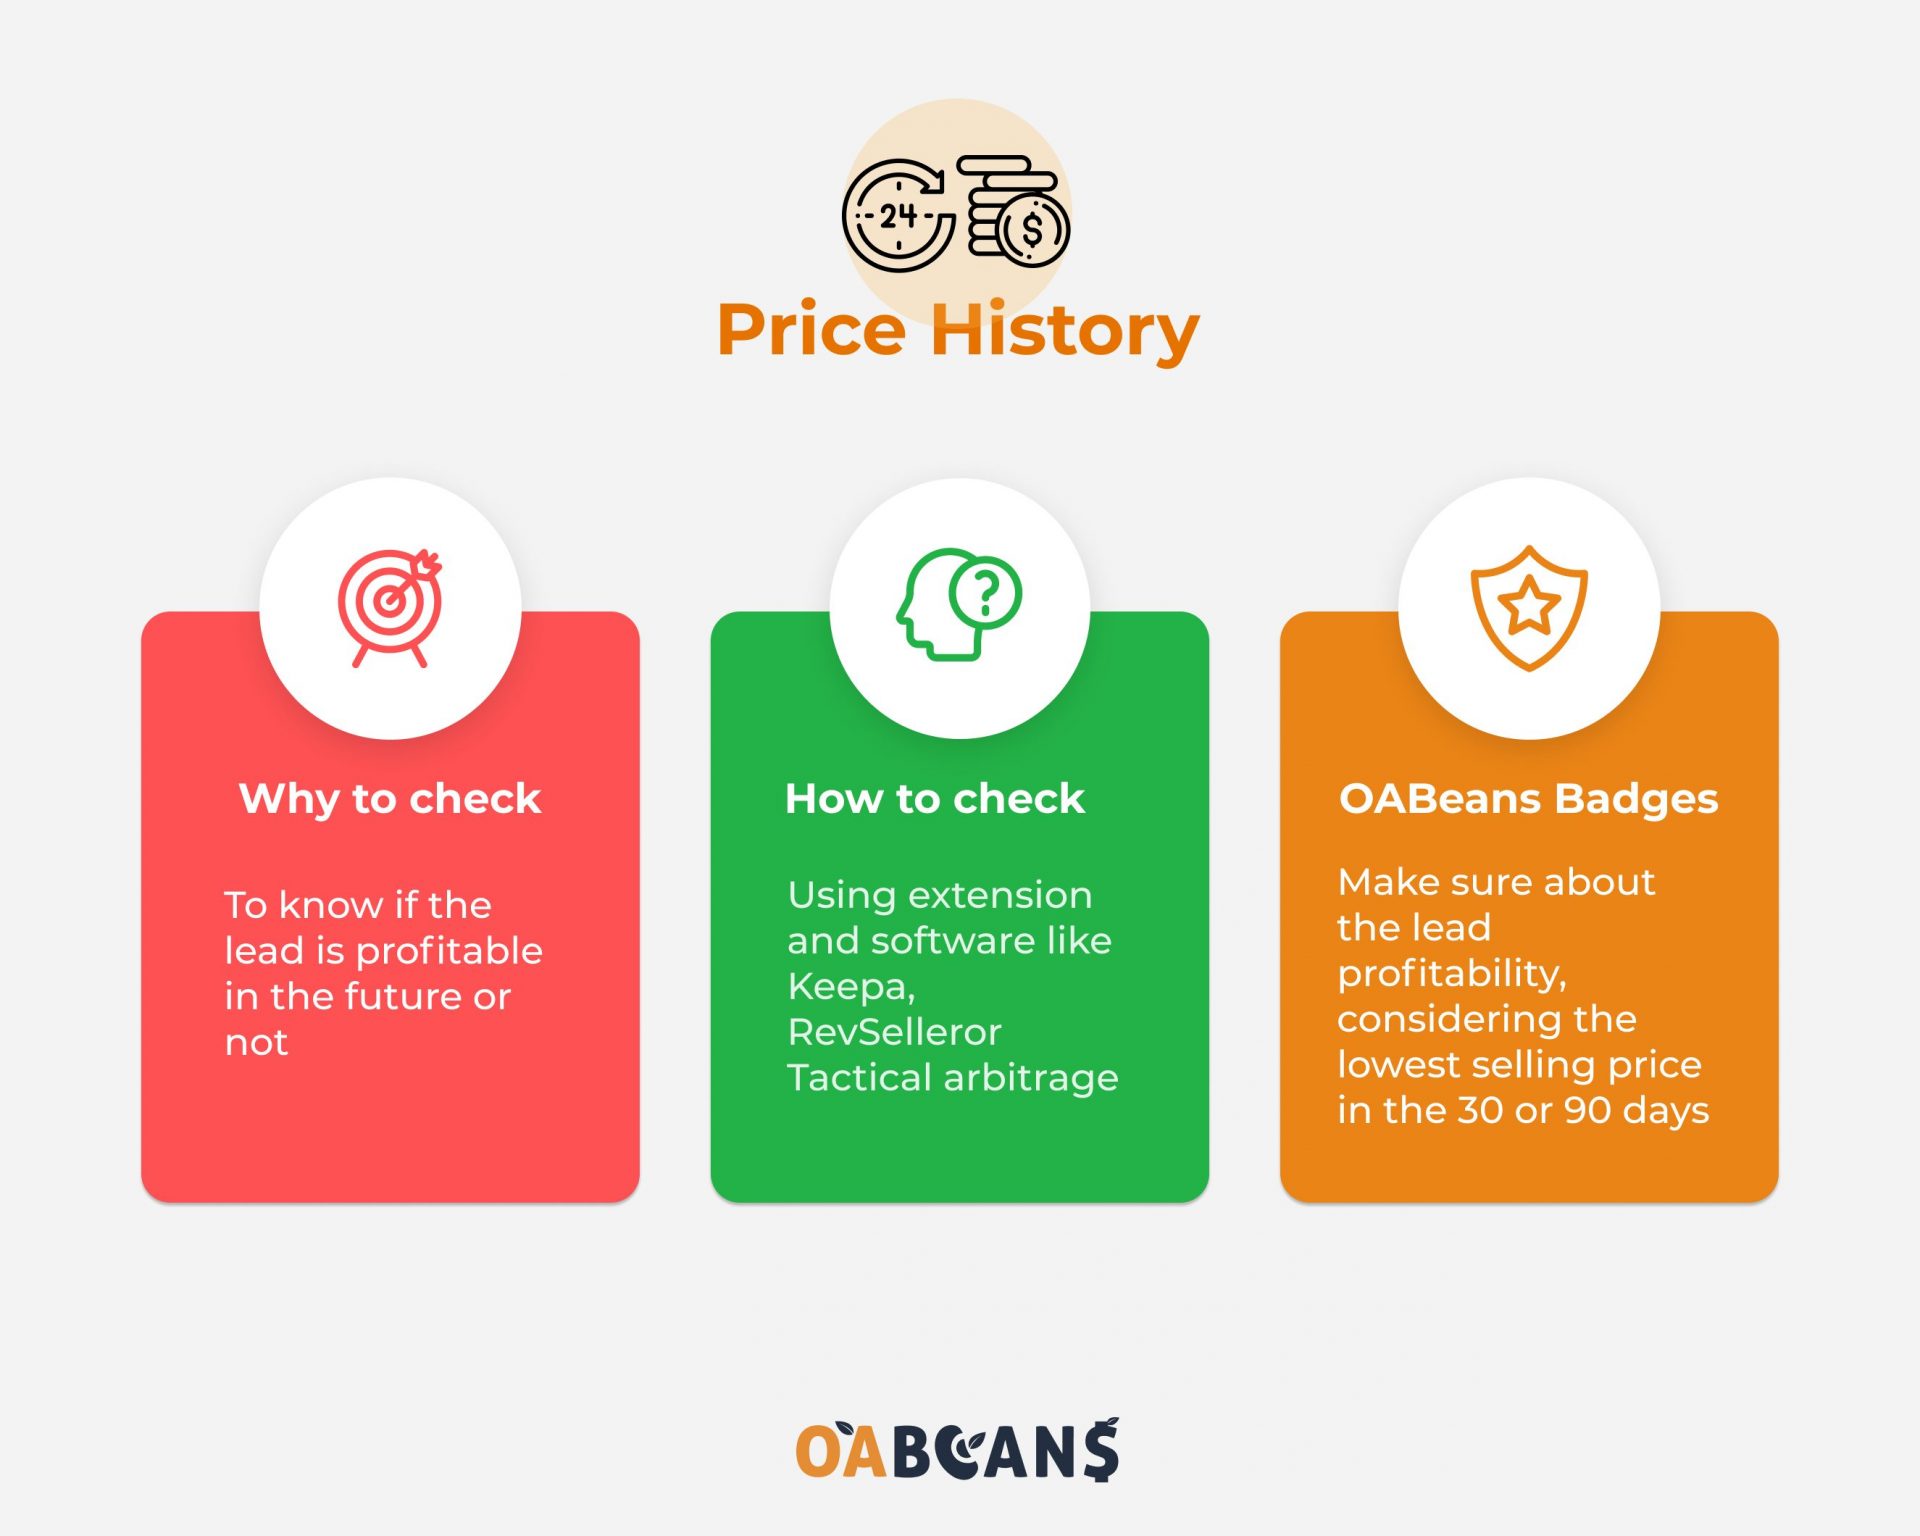
Why it’s essential to check the price history?
The quick answer is that whatever is currently profitable is not necessarily future profitable. So, you have to check the selling price history before deciding.
Sometimes Amazon comes and goes as a seller, especially for some ASINs. When Amazon is a product seller, the selling price is usually the lowest, so other sellers can’t compete and win the buy box. You may find many products with a decent margin, but only because Amazon is temporarily out of stock. As a result, you can’t count on the current selling price, and you may want to ignore this OA lead. It is not always the case when Amazon is a potential seller; a drop in the selling price may happen even when 3rd party sellers have the buy box.
In the online arbitrage business, one of the worst things that can happen is buying a product to make a profit, but you cannot sell it and end up losing money or, at best, making no profit. It’s inevitable that every time you buy a product, you take a risk. However, if you assess the price history of a product, you’ll significantly decrease the risk and improve your work quality.
Where to check the price history?
Many software and extensions show you the price history chart of a product, most of which use Keepa as their source. The easiest way to check the price history for a product is by using extensions to see the price history chart on the product page on Amazon. Keepa has an extension, but after years of working with different extensions, we think RevSeller is the most efficient one.
When you are on a product page, you can see the price history of that product by clicking on “graph” in RevSeller:
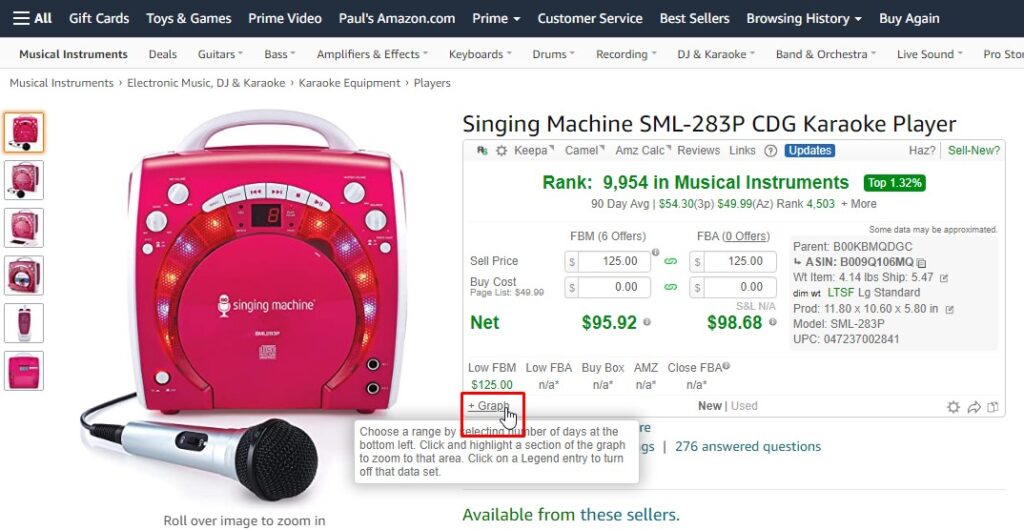
When you click the graph, you can see the price history from the first date this ASIN existed. Also, you can choose to see 30-day or 90-day prices.
Want to read more about this tool? Give this article a look: What is Revseller.
How to interpret the graph?
There is no one right answer to this question. It depends on your strategy and the risk that you are willing to take. However, there are some hints for assessing the graph and making your decision based on real data.
Generally, you should forecast the future price using historical data. Obviously, we shouldn’t expect sellers to be data scientists with data analysis skills; Also, time is money, so we don’t like to spend much time on each graph. What we need is a quick guess about the future price.
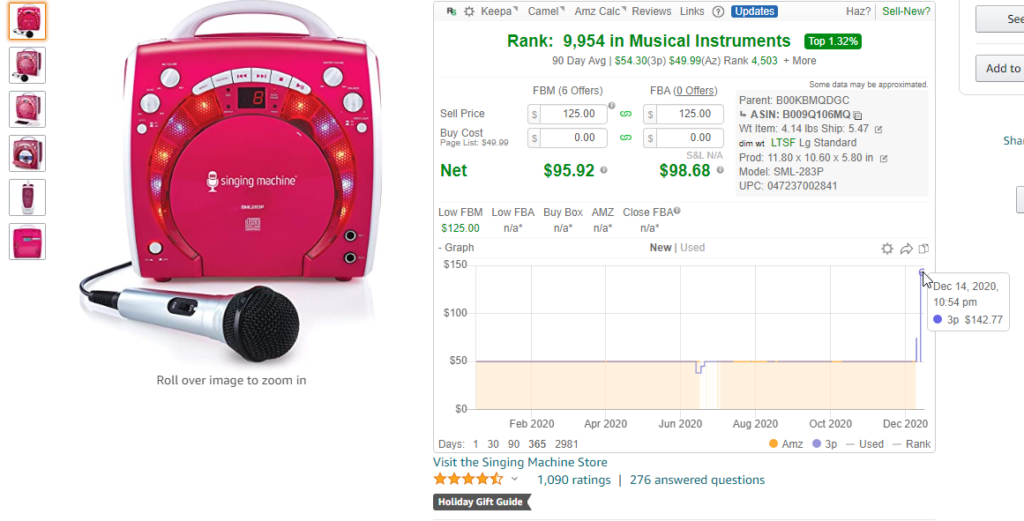
Sometimes, guessing the future price is not hard. For example, consider this graph:
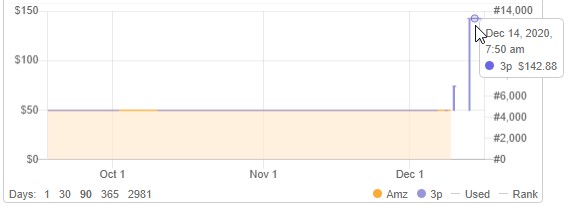
As you can see, the current price is 143$, but in the last 90 days, the price was about 50$. Everyone would admit that the 143$ is unreliable, and no one should make a purchase based on this selling price. It’s very likely that the price will drop again by 50%. So, in this case, most of the experienced sellers would skip this ASIN.
However, it’s not always that easy; sometimes, the price fluctuates. What should you do in these cases?
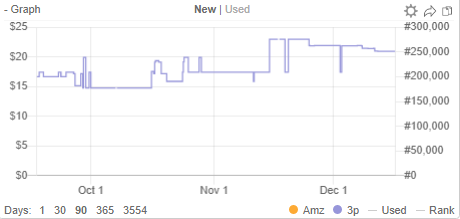
One conservative strategy is that you consider the lowest selling prices at a 90-day price history (or even more). If the chart fluctuates, you don’t like to take any risks. This strategy has its own pros and cons:
- Pros: low risk
- Cons: Hard to find reliable products
The other strategy could be for risk-takers. They usually evaluate the price history for 30 days or less. In this strategy, sellers do not like to ignore products because they are unsure about the future price. They want to take more risks. Maybe they couldn’t sell some purchased items because the price dropped, but they sold more items during that time. So, it’s likely that extra successful sales compensate for a few failed ones.
However, it’s evident that there are other strategies between the conservative and high-risk ones. Every seller should find out what works best for them, considering their personality and other aspects of their online arbitrage business.
Read More: Advanced Online Arbitrage Tips
OABeans 30-day & 90-day badges
At OABeans, drawing on our years of experience doing OA, we devised rules to interpret the price history graph. We have developed a software program to assess the price history: Our software reads the data from Keepa and forecasts a price for the future. In the spectrum of different strategies, our strategy is more on the conservative side. For every online arbitrage lead that we send to our subscribers, we assess the price history chart and put a badge in front of the leads.
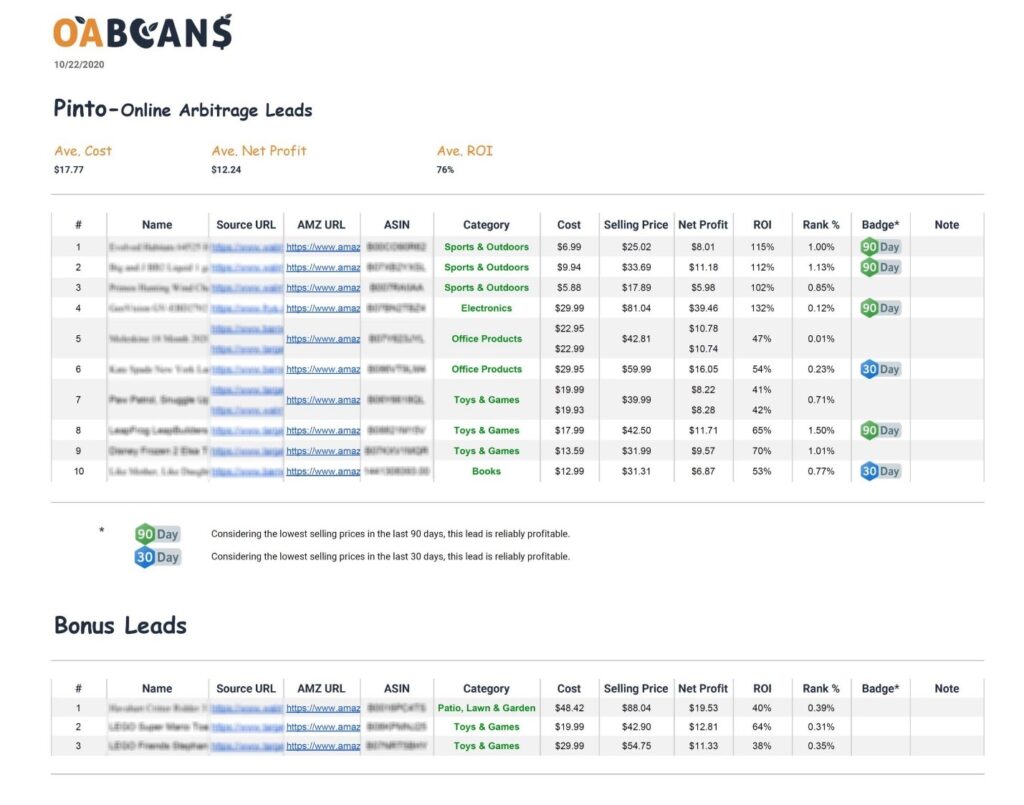
90 Day badge means considering the lowest selling prices in the last 90 days; the lead is reliably profitable.
30 Day badge means considering the lowest selling prices in the last 30 days, and the lead is reliably profitable.
So, if you subscribe to one of our Online Arbitrage Sourcing Lists, you don’t need to worry about the price history for every product. However, for the other leads with no badge, you still need to check the price history graph and make decisions based on your preferences.


11 replies on “Checking Products Price History in Online Arbitrage”
Your site is a valuable tool for anyone in the Amazon online arbitrage industry. The resources you provide have helped me make better decisions and grow my business more effectively.
Thanks for the guidance on navigating Amazon’s seller tools and dashboard.
I appreciate how your website provides a balanced approach to selling on Amazon Marketplace, emphasizing the importance of both short-term wins and long-term sustainability.
The insights shared here are invaluable for anyone looking to excel at online arbitrage on Amazon.
The FAQ section is a helpful tool for addressing common questions and concerns that Amazon sellers may have.
The best part about Amazon Marketplace is that it never closes – I can shop anytime, anywhere!
By leveraging Amazon’s vast customer base and global reach, retail arbitrage on Amazon allows you to tap into a massive market of potential buyers.
Amazon’s seller central dashboard provides a comprehensive view of your reselling business, allowing you to track performance, monitor inventory, and analyze sales data.
The data-driven decision-making enabled by Amazon’s seller analytics empowers you to optimize your pricing, inventory management, and marketing strategies for maximum profitability.
The Amazon FBA program offers sellers the opportunity to focus on sourcing and product development, while Amazon takes care of the logistics.
By staying informed about market trends and leveraging Amazon’s data, resellers can make informed decisions and source profitable products.